Here’s what on-chain data says regarding how the composition of the transaction activity on the Bitcoin network changed during 2024.
2024 Saw Growth In Some Bitcoin On-Chain Metrics, But Decline In Others
In a new post on X, the market intelligence platform IntoTheBlock has discussed about how the key indicators related to Bitcoin changed over the course of 2024.
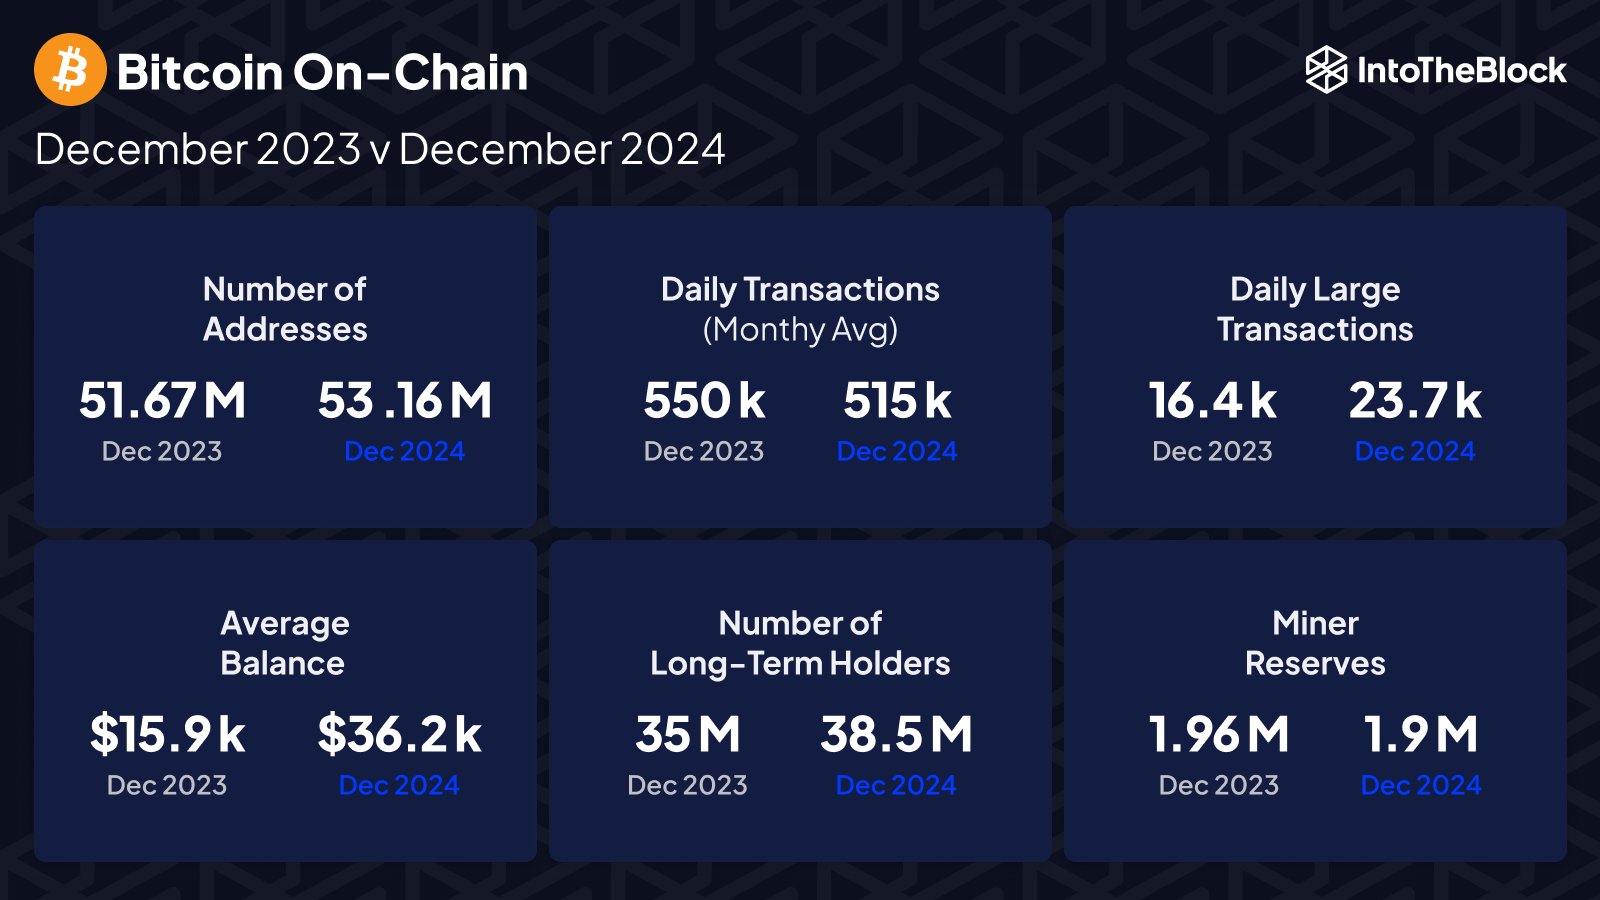
Below is the infographic shared by the analytics firm that breaks the data down:
The change in certain BTC addresses between December 2023 and December 2024 | Source: IntoTheBlock on X
The first metric listed in the infographic is the “Number of Addresses,” which keeps track of the total number of wallets that exist on the Bitcoin blockchain. In December 2023, the indicator stood at 51.67 million, while in December 2024, its value was 53.16 million, suggesting the cryptocurrency’s user base grew during the year.
Interestingly, though, despite this growth, network activity has actually gone down, as the data for the second metric, the Daily Transactions, would show. BTC’s monthly average transfers amounted to 550,000 at the end of 2023, but the metric only registered a value of 515,000 to close off 2024.
This represents a decrease of more than 6% in Daily Transactions for the blockchain. Another metric related to transfers, the Daily Large Transactions, has curiously gone up in the same period. This indicator tracks the transfers that are valued at more than $100,000.
2024 saw the metric grow by over 44%. Transactions that are this large usually correlate to activity from the key investor groups of the market, like the whales. Thus, it would seem that it’s the smaller investors that have been making fewer trades this year, while large holders have only upped their interest in the cryptocurrency.
HODLing behavior on the network also appears to have strengthened during 2024 as the Number of Long-Term Holders has gone up from 35 million in 2023 to 38.5 million in 2024. Long-term holders (LTHs) refer to Bitcoin investors who have been holding onto their coins for more than a year.
This could perhaps be an optimistic development for the asset, as it suggests the holders are willing to be in it for the long run, despite the sharp increase the asset’s price has already observed during the past year.
What may not be so positive, though, is the fact that the miners have participated in distribution. In total, these chain validators have decreased their total holdings by around 60,000 BTC, worth $5.8 billion at the current exchange rate, and corresponding to a decline of 3%.
BTC Price
Bitcoin is currently attempting another recovery run as its price has reclaimed the $96,800 mark. It only remains to be seen, however, if this rally would actually amount to anything, or if it would fail just like the other ones BTC showed during the last couple of weeks.
The trend in the price of the asset over the last five days | Source: BTCUSDT on TradingView
Featured image from Dall-E, IntoTheBlock.com, chart from TradingView.com


